Drones, Deficits and De-Dollarization
The precious metals complex started last week well bid on reports that the Ukrainian military launched high-impact drone strikes deep into Russian territory, hitting airfields and destroying more than 30 strategic aircraft.
In response, Moscow carried out its most extensive aerial assaults on Ukraine in recent months using cruise missiles to target Kiev and surrounding military sites.
On the other side of the Atlantic, the US Congressional Budget Office (CBO) scored the current reconciliation bill to add $2.4 trillion to the current deficit, which pressured the USD lower.
Physical Gold priced in USD tagged a three-week high at $3403.00 before sliding lower to close fractionally higher for the week at $3309.00
Gold denominated in AUD traded within recent ranges and posted a marginally lower close for the week at $5098.00.
Physical Silver bolted higher last week and outperformed Gold by a wide margin.
Silver priced in USD reached a 13-year high at $36.35 and finished the week 9.1% higher at $35.97.
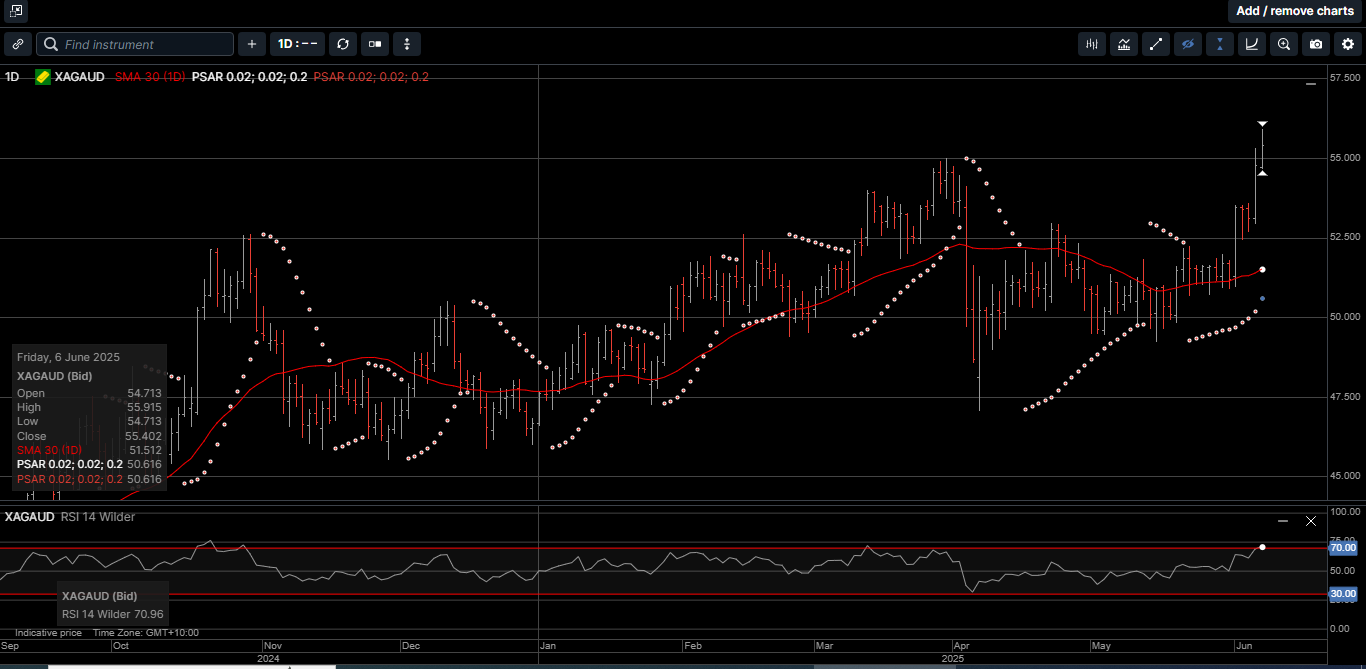
Silver denominated in AUD reached a new all-time high at $55.95 and closed out the week with an 8.4% gain at $55.40.
This strong performance in Silver prices saw the Gold versus Silver ratio move 7.6% in favor of Silver down to 91.90.
As illustrated on Chart 1, last week was the second largest weekly trading range in the Gold versus Silver ratio since July of 2020. After such a large move, some consolidation could be expected this week.
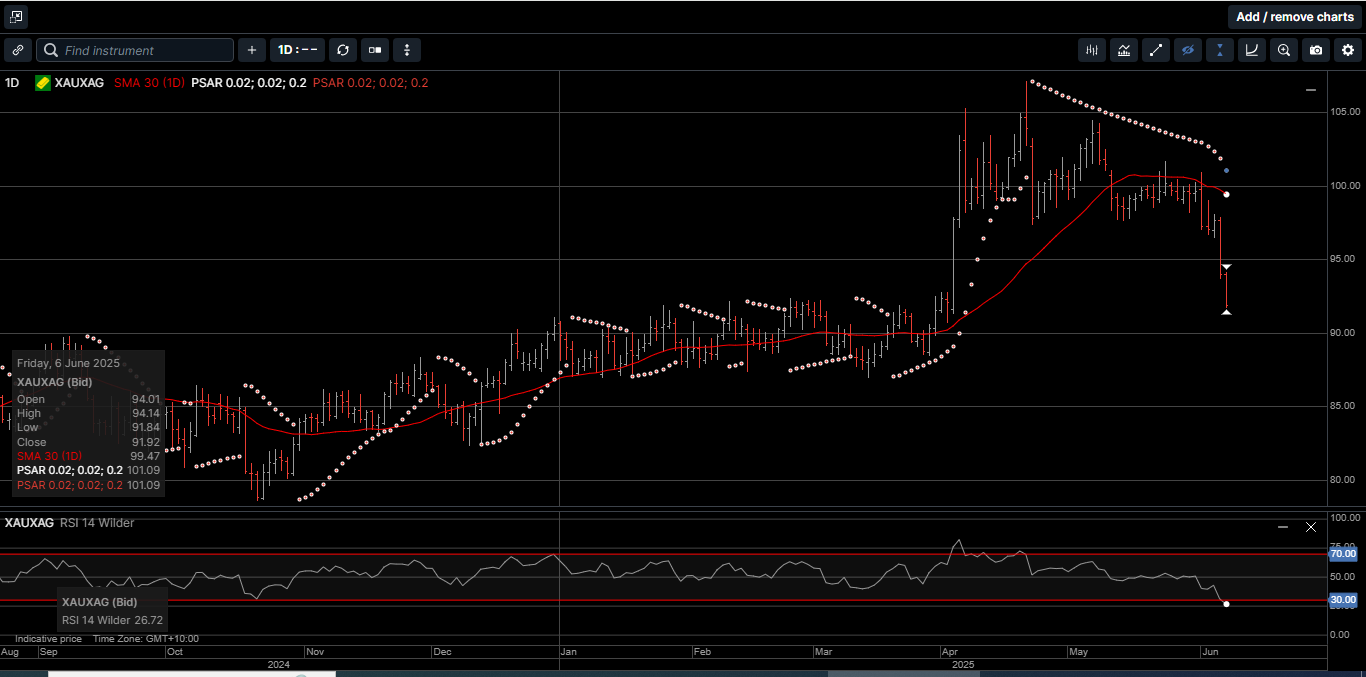
With the ratio at 91.90, it takes 91.90 ounces of Silver to equal the price of one ounce of Gold. On April 22nd, this ratio stood at 103.00
Over the next few weeks, we expect to see more market movement based on adjustments to the budget reconciliation bill currently being debated.
According to the CBO, the House-passed budget reconciliation bill, also known as the Big Beautiful Bill, would increase the US deficit by $2.4 trillion over a decade and ultimately result in nearly 11 million individuals losing access to health insurance.
Last week’s CBO numbers are largely in line with preliminary estimates but nonetheless could complicate the path forward for the budget package, which will undergo a thorough Senate review over the next few weeks.
The CBO scoring doesn’t include the dynamic effects of the bill on the economy, which could lower the overall price tag. These dynamic effects follow the Laffer Curve theory, which suggests that tax revenue actually increases when tax rates are lowered.
The Joint Committee on Taxation previously said an earlier version of the House bill would cost about $100 billion less than the CBO estimates because of positive growth effects. The CBO said an updated economic analysis of the full package will be forthcoming.
The CBO data also don’t show the effects of additional interest payments needed to service the rising debt, which could push the total cost closer to $3 trillion, before dynamic growth effects are taken into account.
Overall, last week’s CBO score nets out to $2.4 trillion after a $3.7 trillion estimated revenue reduction from tax cuts, minus an estimated $1.3 trillion in spending cuts, which is all lumped onto the current debt of over $36 trillion.
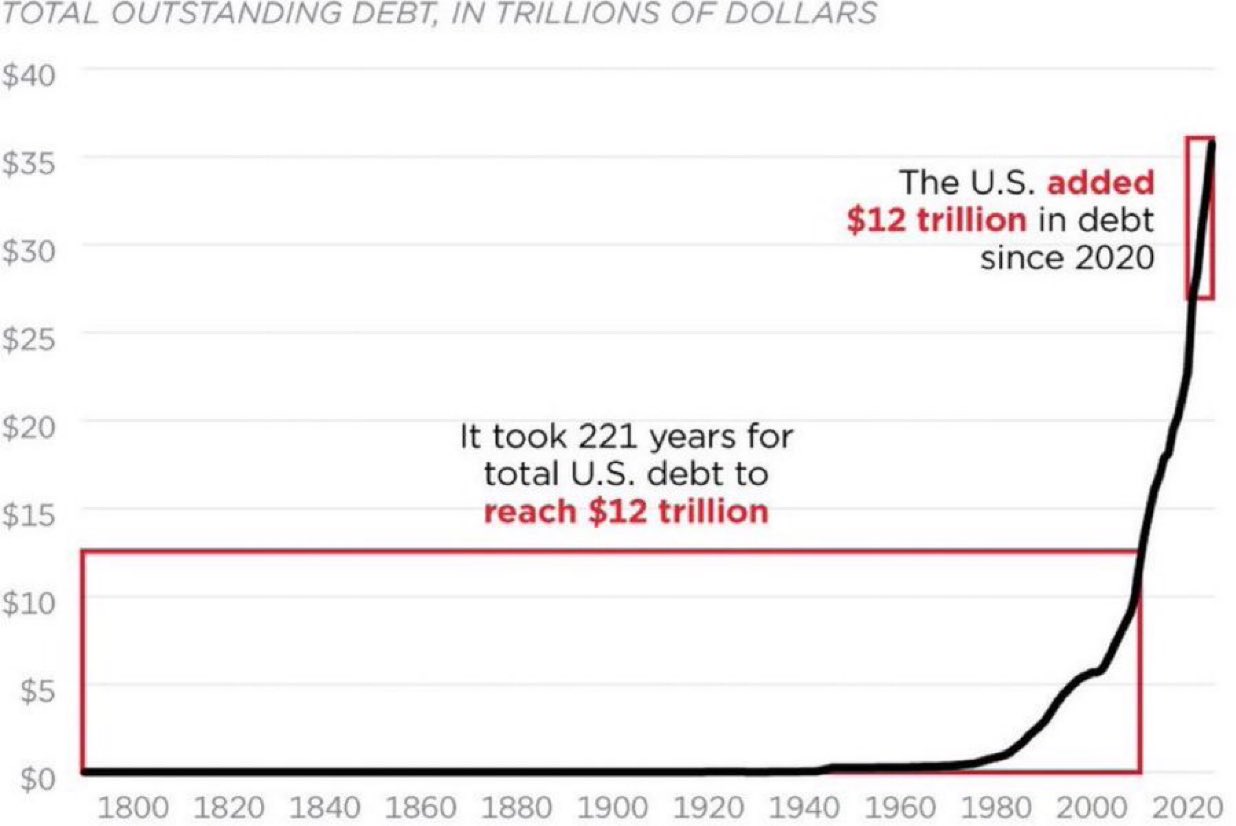
Interestingly, as shown on Chart 2, it took the US over 200 years to amass a $12 trillion debt. But the US has subsequently added another $12 trillion just since 2020.
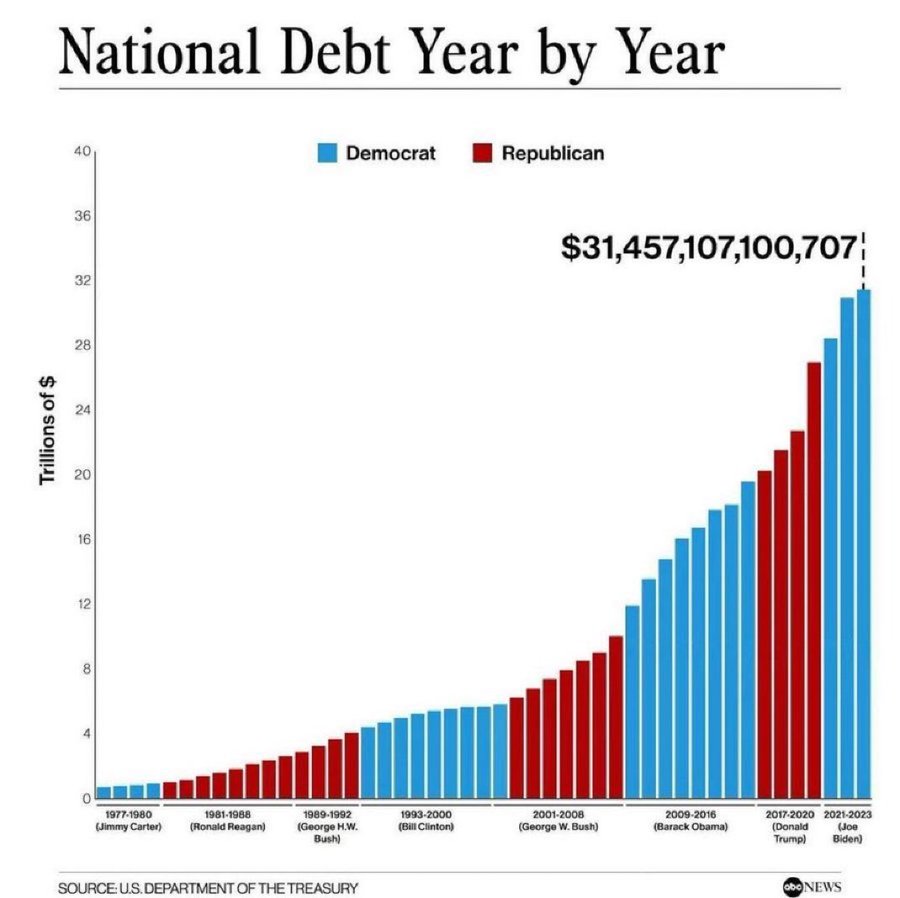
And further, it’s not just one political party that has caused this ballooning debt. As shown on Chart 3, the US is bipartisan when it comes to fiscal profligacy with both Democrats and Republicans increasing the debt.
Chart 3 – Debt By Year
One of the knock-on effects of the prospects of higher US debt and deficits has been a steady slide in the USD, which is generally bullish for Gold and Silver.
In fact, last week the USD fell to new lows for the year versus five of the G-10 currencies including the British Pound and the Canadian, Australian and New Zealand dollars.
And as governments struggle to contain rising debts and deficits, and geopolitical tensions steadily escalate, the popularity of physical hard assets seems to grow with each passing month.
All things considered, the recent pullback from the April highs for Gold and Silver has been a dramatic call to action for provident, long-term investors looking for a secure cornerstone asset within a diversified wealth creation strategy.
Chart 4 – Gold AUD
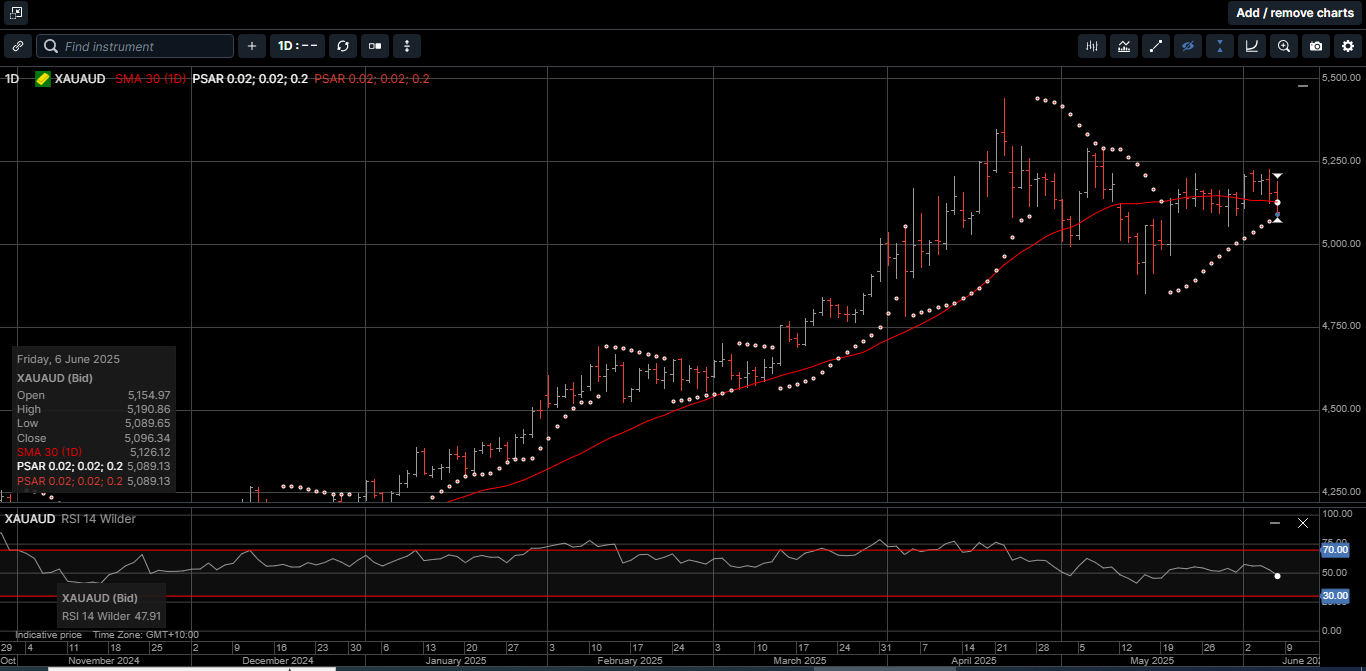
Chart 5 – Silver AUD
This publication has been prepared for the GBA Group Companies. It is for education purposes only and should not be considered either general of personal advice. It does not consider any particular person’s investment objectives, financial situation or needs. Accordingly, no recommendation (expressed or implied) or other information contained in this report should be acted upon without the appropriateness of that information having regard to those factors. You should assess whether or not the information contained herein is appropriate to your individual financial circumstances and goals before making an investment decision, or seek the help the of a licensed financial adviser. Performance is historical, performance may vary, past performance is not necessarily indicative of future performance. Any prices, quotes or statistics included have been obtained from sources deemed to be reliable, but we do not guarantee their accuracy or completeness.